日本語 / English

Home > Archive, When genrated Hikikomori phenomenon?
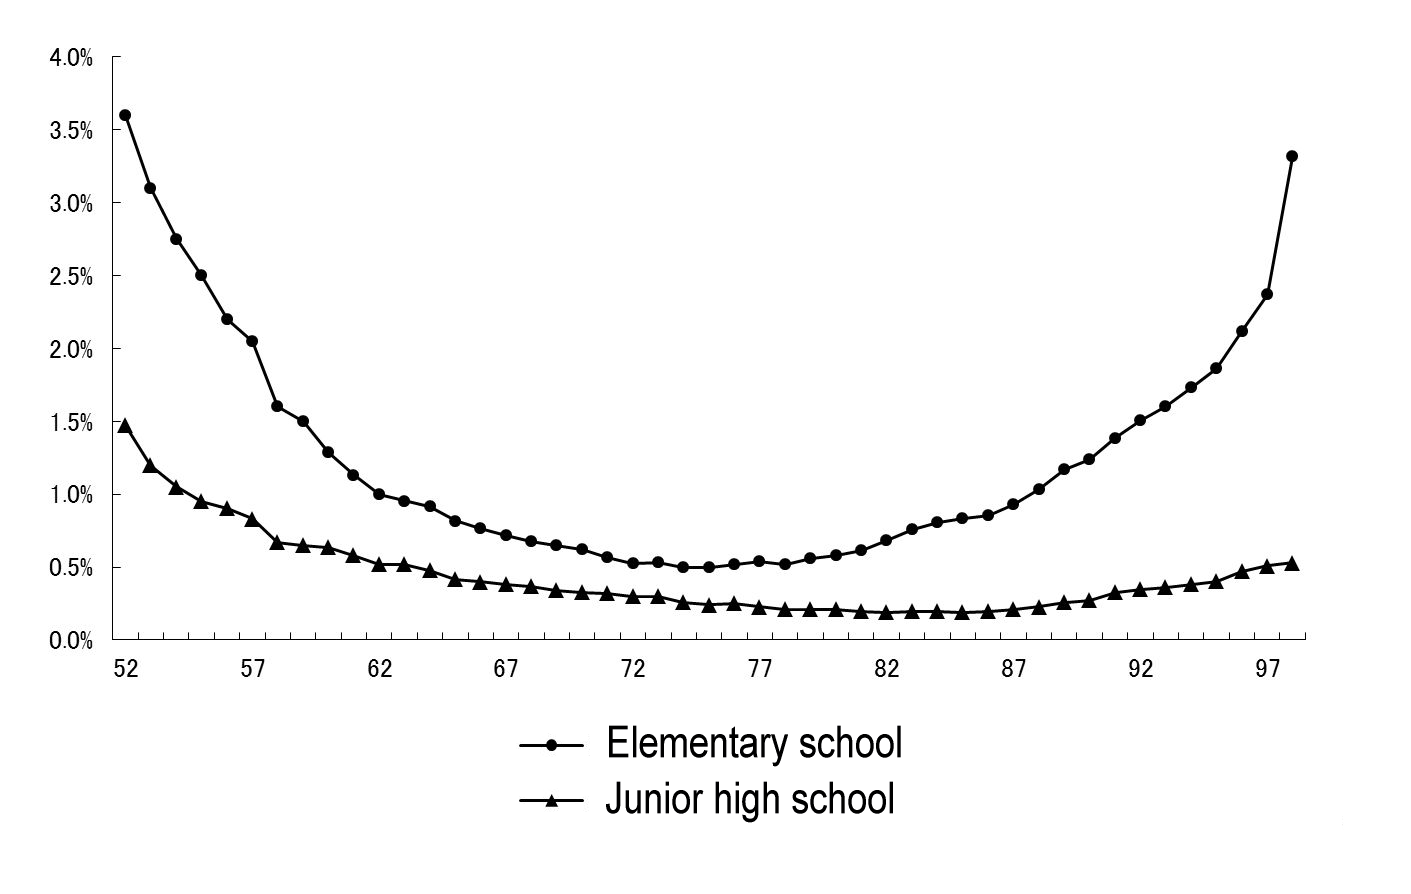
Figure: Transition of the long-term absence student rate (50 days or more yearly).
[Figure adapted from Ministry of Education, Culture, Sports, Science and Technology "School basics investigation" (1953‒1999), Hosaka (2000).]
When generated Hikikomori phenomenon?
Hikikomori showed up in the 1970s and increased drastically in the 1980s and 1990s. Tamaki Saito (psychiatrist) said the following.
I had clinical experience to examine hikikomori as ordinary cases at the time of the mid-1980s, when I was a freshly become a doctor (Saito 2002:34).
Also, according to Sadatsugu Kudo—the representative of the NPO corporation "Youth Independence Assistance Center"— he continues to be involved in the hikikomori problem from the earliest and assisted on a hikikomori case in 1978 for the first time (Saito 2003: 52).
The transition of futoko is circumstantial evidence for these testimonies. We shall pay some attention to using the futoko statistics. The Futoko statistics have various problems. There is an enormous gap in the futoko rate by prefectures. The highest value of the futoko rate is 52.7% (Aomori Prefecture) in elementary schools and 89.9% (Aomori Prefecture) in junior high schools. On the other hand, the lowest value is 22.0% (Nagasaki Prefecture) in elementary school and 48.6% (Ehime Prefecture) in junior high school.
There is more than a 30–40% gap between each prefecture. There may be a local difference in education level, but we cannot just accept this number. As a condition, there is not a gap of 30–40 % in between each prefecture, and we should consider this difference as the policy of the Board of Education on how to count futoko children. For example, it is better for the school and the parents that students are recorded as "sickness" rather than "futoko." Thus, there are a lot of students whose absences are recorded as due to sickness and not futoko.
Hosaka (2000) describes that a lot of futoko students are counted as absent due to illness. Some prefectures that have a low futoko rate among long-term absentees record futoko absences as due to illness. In these data, the number of futoko students is low.
Considering these circumstances, it's difficult to understand the actual condition from futoko statistics. It is better to use the long-term absence statistics rather than the arbitrary futoko statistics. The Japanese government did start to record futoko in 1966. However, it is impossible to see the transition pre- and post-1966, and we cannot see a long period trend. For this reason, we will use the long-term absence statistics for the analysis.
Figure: Transition of the long-term absence student rate (50 days or more yearly).
[Figure adapted from Ministry of Education, Culture, Sports, Science and Technology "School basics investigation" (1953‒1999), Hosaka (2000).]
This graph has a characteristic valley shape. The bottom of the valley corresponds with the mid-1970s. Long-term absence from school was not uncommon before the 1970s. After World War II for a while, a lot of Japanese were poor and had tough lives, so for some people, it was difficult to go school. Japan had poor medical care, and there was a lack of medical supplies in those days. Also, the whole Japanese society didn't have a standard view that children must go to school.
After that, all Japanese children went to school in the 1970s. But, we can read that futoko showed up gradually in the mid‒70s and increased remarkably from the 1980s to the 1990s.
After that, all Japanese children went to school in the 1970s. But, we can read that futoko showed up gradually in the mid‒70s and increased remarkably from the 1980s to the 1990s.
70–80% of hikikomori experienced futoko. These two phenomena have a very close relationship.
Thus, some of the futoko students shifted to hikikomori in the mid-1970s. That is the hikikomori phenomena in Japan.
Let's think about the virtual cases. They were 13 years old (first grade in junior high school in Japan) in 1975 at the valley of figure. Evidence of 40-year-old hikikomori has recently become public. They were born in 1962 and are now 54 years old. They are the so-called "first generation of hikikomori." They became the futoko in the 1970s and shifted to hikikomori, maintaining their conditions. We discover them as middle-aged hikikomori.
The first generation of hikikomori shifted to hikikomori in the 70s; they are small-scale compared to the late years. Futoko increased drastically in the 1980s. Accordingly to the figure above, the second or the third generation of Hikikomori—they became Futoko in the 1980s and the 1990s—is several times larger than the first generations.
We can understand that hikikomori increased in the 1970s, from testimonies of the medical doctors and supporters, the transition of the long-term absentee and generalization of the middle-aged hikikomori.
Hikikomori is a very modern phenomenon that generated during the past few decades.
Reference:
Hosaka T, 2000, Children to be absent from school—Considering the school education from the long-term absence and Furoko, University of Tokyo Press.(amazon)
Kado S, Takigawa K, Takaoka K, 1998, Solving the Futoko—proposals from the three psychiatrists, Minerva-shobou.(amazon)
Ministry of Education, Culture, Sports, Science and Technology, 1953‒1999, "School basics investigation."(webpage)
Saito T, 2002, The Hikikomori Rescue Manual, PHP Institute.(amazon)
Saito T, 2003, Hikikomori Culture, Kinokuniya-Shoten.(amazon)
Ministry of Education, Culture, Sports, Science and Technology, 1953‒1999, "School basics investigation."(webpage)
Saito T, 2002, The Hikikomori Rescue Manual, PHP Institute.(amazon)
Saito T, 2003, Hikikomori Culture, Kinokuniya-Shoten.(amazon)